Help articles
CATEGORY: Analytics
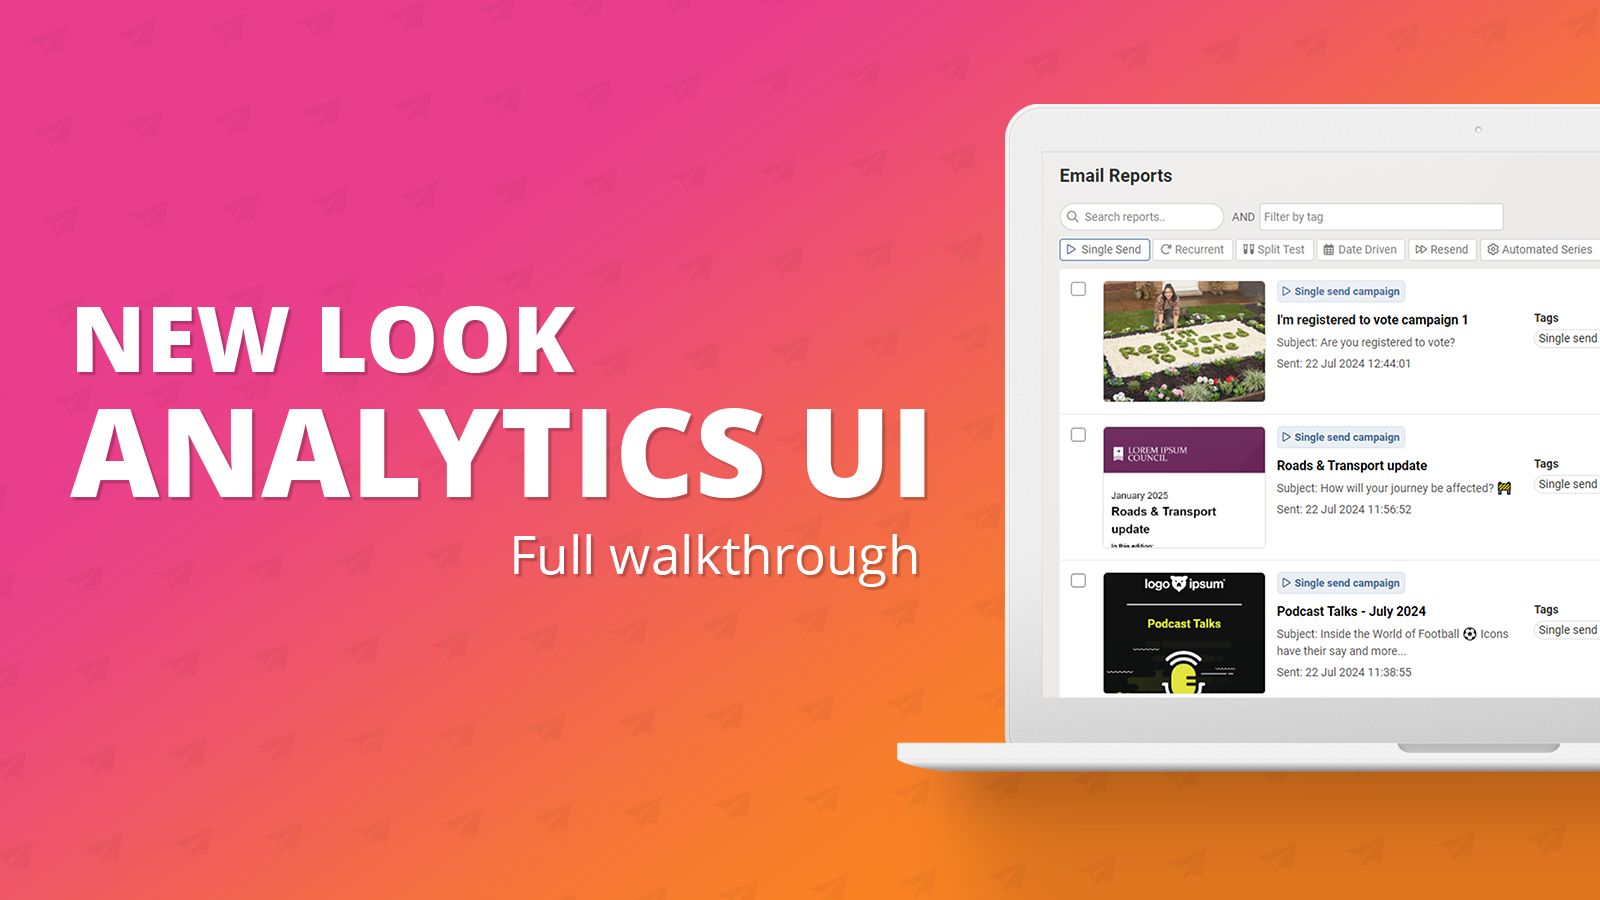
Analytics UI (New): Full walkthrough
This help article will run through everything you need know about the new looking analytics page, however, please note the features and functionality remains the same.
Below you can see a snapshot of the new look page.
Firstly, you'll notice the page is much more user friendly and has been brought in line with the designs and new campaigns pages you will all be familiar with.
Let's jump into how you can navigate the page as well as where to find some of the key links you may currently be using when reviewing your analytics.
At the top of the page, you’ll find several ways to filter your campaign reports
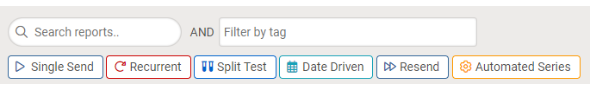
Search function: This is your usual search bar to find any campaign reports
Filter by tag: This is a new way to filter your campaign reports, using the new campaigns experience, it is possible to assign a tag to your campaign. This tag will now be carried across to the email reports page. Making it much easier to differentiate reports e.g. Fostering or Environment updates can use two separate tags.
To find out more about assigning tags to campaigns, see the help article here.
Filter by campaign type: Using the campaign types, you can click and unclick them to show/hide them from the reports list page. For example, if you only wanted to see single send campaigns, you can deselect all other campaign types to do so.
In the top right-hand corner of the page, you will a few links and various actions you may be familiar with.
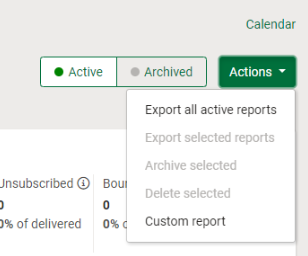
Active reports: These are the currently active reports, including recent campaigns and currently running ones such as automated series. Campaigns are automatically archived between 3-12 months after their send date, depending on the account's settings. The account admin has the ability to select the time period they feel most fitting for your organisation.
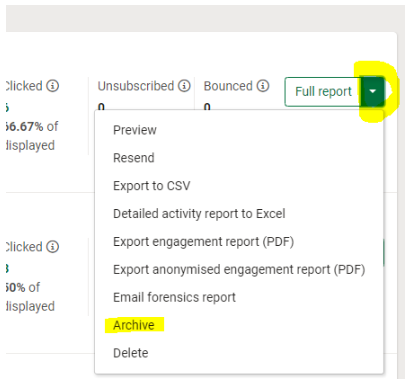
Archived reports: Campaigns are automatically archived between 3-12 months after their send date, depending on what the account admin has set in the account's settings, but they can be archived by the user before 3 months as shown below.
Calendar: Upon clicking this you are taken straight to the e-shot campaigns calendar where you can see any scheduled campaigns that are coming up.
Actions dropdown: This dropdown provides several options such as the ability to export, delete or archive selected reports.
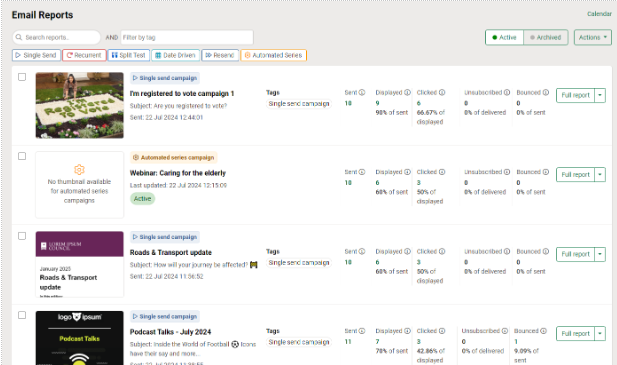
Below all these options you will find all your campaign reports in a new list style which now shows you more than before including a preview of the sent design, the subject line used, and any tags assigned to the campaign.
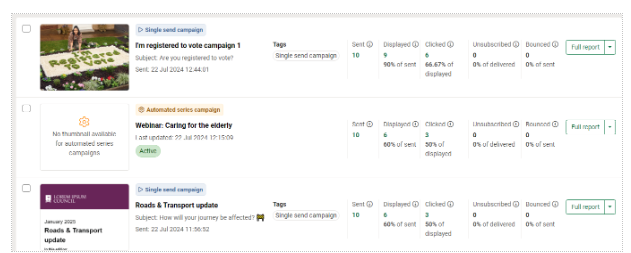
The same stats including the total sent, displayed and clicked etc are still displayed and each number can be clicked into to see the list of contacts that make up that number.
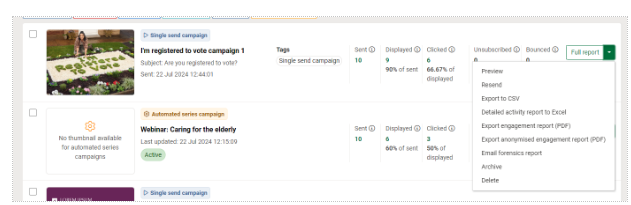
Again, just like you are used to, the dropdown to the right of each campaign can be opened to provide you with several options such as previewing the design, exporting various reports or performing a resend campaign as shown below.
And finally, the ‘Full report’ button remains. Clicking into this will provide you with the full report and more details into your campaign's performance.
Upon clicking the ‘Full report’ button you will be taken to the below page.
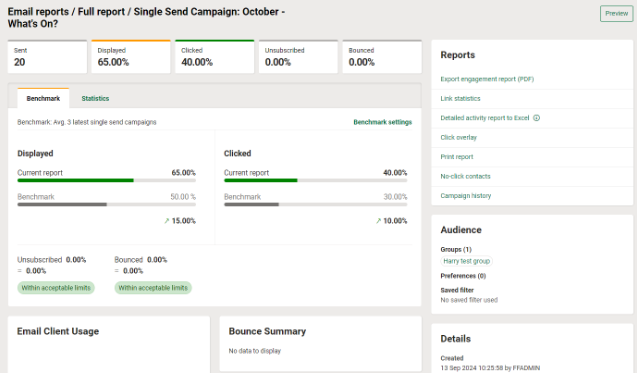
Now let's delve into the details of this new look page. At the top of the page, you will see the generic stats for this campaign send including how many it was sent to and several percentages including displayed and clicked.
Below these campaign stats, we have introduced a brand new ‘Benchmarking’ system. Upon clicking the full report, you will be taken to this tab, but there is also a ‘Statistics’ tab which we’ll look at next.
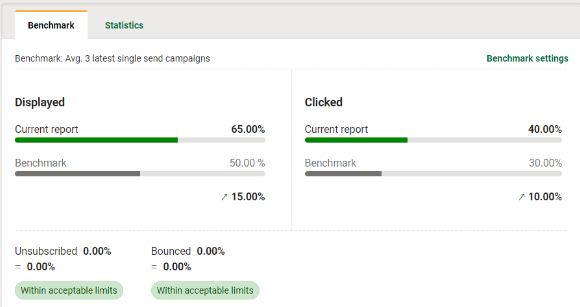
The benchmark compares this campaign send against the latest three single send campaign sends. So as seen in the above image, the campaign we are viewing the full report for had a display rate of 65% compared to the benchmark across the past 3 sends being 50%, thus being up 15% as shown with the up arrow. The same also applies to the click through % as seen on the right.
Just below the displays and clicks benchmark, you will also be able to see the unsubscribe and bounce rates for your campaign, where we will now tell you if you are within the acceptable limits or not.
Now, I'm sure many of you would like to benchmark your campaigns against email sends and not just the past three sends. Don't worry! We have made this possible through campaign tags. To find out how to apply these to your campaign before sending it, see our dedicated help article here.
Back to the report, you can change your benchmark settings by using the ‘Benchmark settings’ link in the top right corner.
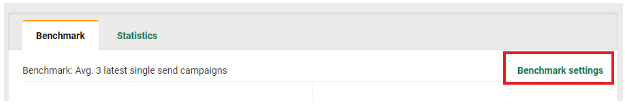
Upon clicking this link, the modal below will appear.
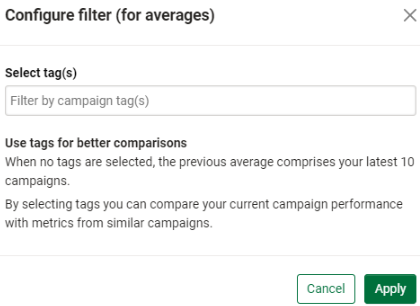
Here you will find a brief description of how comparisons/benchmarking works but also can benchmark against a particular campaign tag and not just the previous sends.
To do so, click into the box and select the tag you want to benchmark against. For this example, I will use the ‘Monthly Newsletter’ tag.
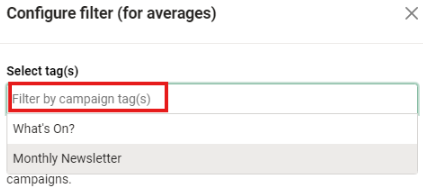
Once selected, you will see the tag now shows in the ‘Select tag(s)’ box, you can add more tags if you wish, doing so will benchmark across the previous 3 campaign sends for only the selected tags.
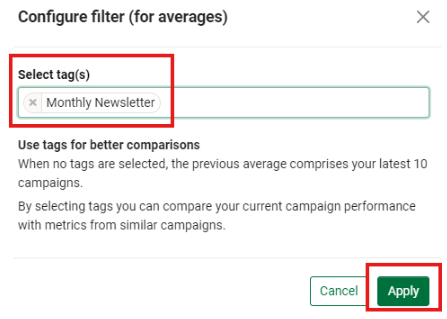
Once you are happy with your tag's selection, hit the ‘Apply’ button. This will return you back to the benchmark stats as shown below.
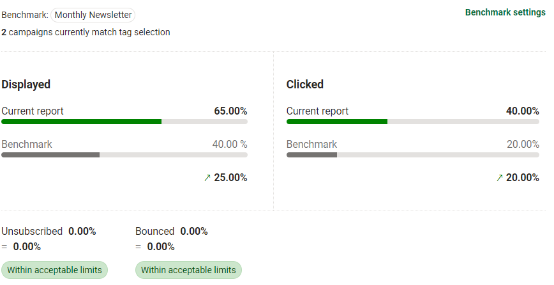
Now, you will see similar data is shown to me, however it is now only benchmarking against the ‘Monthly Newsletter’ tag and not just the previous campaign sends.
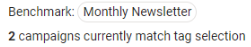
As seen in the top left you can see which tag you are benchmarking against as well as the number of campaigns sent.
For full details on using tags and benchmarking, you can find a dedicated help article here. (NOT YET LIVE)
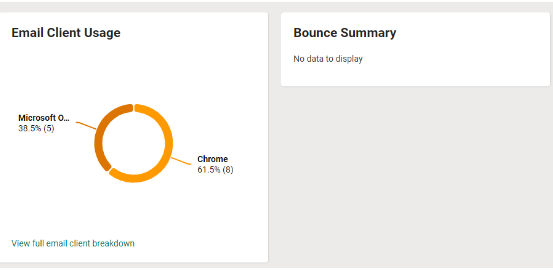
Following on from the benchmarking section, just below, you will find some graphs you are used to seeing, those being the ‘Email client usage’ and the ‘Bounce summary’. These have both had UI improvements made to them, but the reporting remains the same as before.
Heading back to the top of the page, on the right-hand side, you’ll find all the reports you’ll be used to seeing including the detailed activity report and the click overlay.
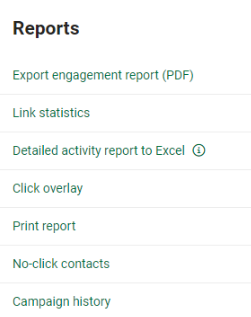
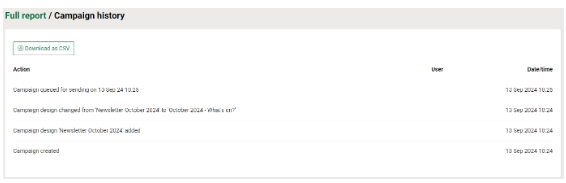
You’ll see a new option here named ‘Campaign history’ - If you’re familiar with the new campaigns experience, you may know we provide a history tab, which essentially keeps an audit for the campaign including who created, if a design has been attached and if an audience has been set.
Previously, once the campaign had been sent, there was no way to access this. So, we’ve made this available in the analytics for the campaign.
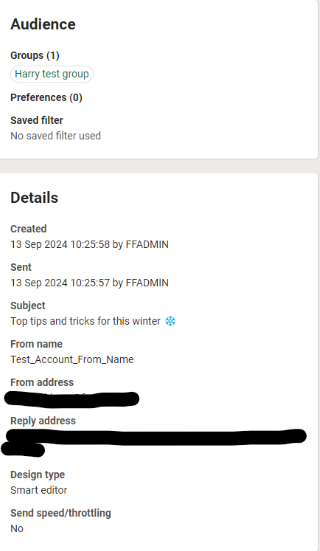
Finally, on this page below the reports, you’ll find numerous details about the campaign including the audience that was used as well as several other details including the subject line and who the email was sent from (from name/address).
Again, coming to the top of the page, let’s switch to the ‘Statistics’ tab.
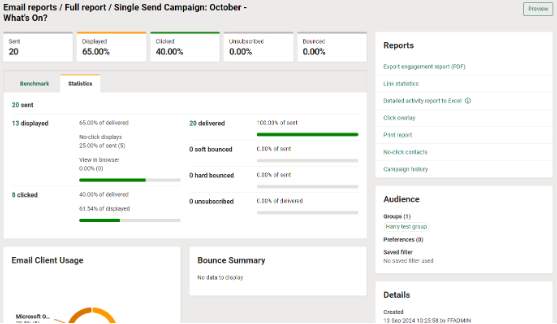
As seen above, some of the same details are shown such as the email client usage, bounce summary and the various details down the right-hand side.
The only difference on this page and between the ‘Benchmark’ and ‘Statistics’ page is that instead of the details at the center of the page comparing the campaign against others, it now only shows details relating to the campaign you are viewing the full report for.
This shows some details you’ll be more used to including a detailed rundown of the number of delivered emails, displays and clicks as well as the bounces and unsubscribes you may have had with this send.
Solutions
Email Marketing
Create email campaigns and newsletters and manage end-to-end subscription processes with forms and preferences.
Marketing Automation
Create sophisticated automated campaigns for email and SMS combined.
Digital Communication
The comprehensive solution to manage and automate your digital communication across email, SMS, websites and landing pages.
Email marketing healthcheck
We are confident that we can help you, which is why we offer a free healthcheck to identify potential issues with your current programme and free advice on things that could be done to improve it.